ESG
Performance
The primary ESG performance data that Prysmian reached in 2023 are shown below, organized according to the structure of the Consolidated Non-Financial Statement (NFS) and of the Sustainability Report. The data are preceded by the list of topics covered, the associated Sustainable Development Goals (SDGs) of the United Nations and Prysmian’s strategic sustainability goals, with precise indication of the state of progress toward reaching the set target.
Governance
Governance: Ethics and integrity
A successful company cannot be built without a solid foundation of ethical and moral principles. That is why Prysmian works every day to ensure responsible conduct throughout the entire value chain. This approach particularly takes the form of strict observance of the regulations the Group must comply with, including tax regulations, whose fulfilment is managed transparently, fairly and truthfully. This involves total observance of tax obligations, without attempts to minimize or dodge.
Topics
SDG's


Goals: 2023-2025 Prysmian Scorecard
| Category | KPI | Material topic and related impact | Baseline 2022 |
Baseline 2023 |
Target 2025 |
|---|---|---|---|---|---|
| Sound governance | Percentage of employee shareholders1 | Well-being, engagement and improvement of human capital skills | Engagement: adoption of people-oriented policies to meet people's needs and demands | 37% | 46% | 44%/45% |
| Percentage of completion of e-training on ethics and integrity issues2 | Well-being, engagement and improvement of human capital skills | Upskilling: reinforcement and improvement of personnel skills and talent development | 75% | 89.3% | 90% |
1 Number of employees with Prysmian shares deposited in company administrative accounts through GROW, YES and BE IN plans as at 31 December, divided by the total number of employees eligible to participate in at least one of the plans.
2 It includes e-learning conducted through the Group's business management system and is for all desk workers (excluding business partners, consultants, contractors, employees on leave of 30 days or more and temporary trainees). It is subject to annual approval of the compliance plan by the Board of Directors; topics may include one or more of the following: code of ethics, anti-corruption, gifts, conflicts of interest, Helpline or business policy.
2 It includes e-learning conducted through the Group's business management system and is for all desk workers (excluding business partners, consultants, contractors, employees on leave of 30 days or more and temporary trainees). It is subject to annual approval of the compliance plan by the Board of Directors; topics may include one or more of the following: code of ethics, anti-corruption, gifts, conflicts of interest, Helpline or business policy.
2023 Performance
Ethics and integrity
| Communication of anti-corruption policies and procedures of the organization | Number | Percentage of total |
|---|---|---|
| Members of the Prysmian S.p.A. BoD | 12 | 100% |
| Employees | 8,504 | - |
| of which white collar | 8,226 | 100% |
| of which external/sales agents | 278 | 100% |
| Business Partners | 4,350 | - |
Tax reporting, country by country (€ million)
| Revenue from related parties | Revenue from unrelated parties | Total revenues | Profit/(loss) before taxes | Corporate income tax paid | Corporate income tax accrued | Number of employees (FTE) | Property, plant and equipment | Employee remuneration | |
|---|---|---|---|---|---|---|---|---|---|
| North America | 1,056 | 4,905 | 5,961 | 612 | 227 | 164 | 7,146 | 1,556 | 548 |
| Canada | 425 | 502 | 927 | 62 | 26 | 19 | 682 | 127 | 53 |
| United States | 631 | 9,403 | 5,034 | 201 | 195 | 19 | 6,464 | 1,429 | 496 |
| LATAM | 409 | 1,853 | 2,262 | 125 | 24 | 55 | 3,275 | 509 | 125 |
| Brasil | 140 | 618 | 758 | 22 | 2 | 13 | 1,673 | 242 | 55 |
| Other | 269 | 1,235 | 1,504 | 103 | 22 | 42 | 1,602 | 267 | 70 |
| EMEA | 5,988 | 9,090 | 15,078 | 187 | 67 | 65 | 16,761 | 3,392 | 996 |
| France | 620 | 878 | 1,499 | -11 | 1 | 2 | 2,570 | 542 | 176 |
| Germany | 219 | 868 | 1,087 | -21 | 1 | - | 1,446 | 228 | 129 |
| Italy | 3,051 | 388 | 3,439 | 12 | 1 | 4 | 766 | 149 | 43 |
| Netherlands | 103 | 499 | 602 | 40 | 1 | 1 | 706 | 169 | 57 |
| Spain | 374 | 781 | 1,155 | 26 | 4 | 2 | 1,198 | 244 | 74 |
| United Kingdom | 62 | 556 | 617 | 30 | 5 | 5 | 1,046 | 160 | 67 |
| Other | 1,559 | 5,12 | 6,679 | 111 | 54 | 51 | 9,029 | 1,9 | 449 |
| APAC | 365 | 1,097 | 1,463 | 21 | 11 | 15 | 2,903 | 312 | 98 |
| China | 239 | 411 | 650 | 30 | 5 | 8 | 1,608 | 138 | 40 |
| Other | 126 | 686 | 813 | -9 | 6 | 7 | 1,295 | 174 | 58 |
| Total | 7,818 | 16,945 | 24,764 | 944 | 329 | 299 | 30,085 | 5,769 | 1,767 |
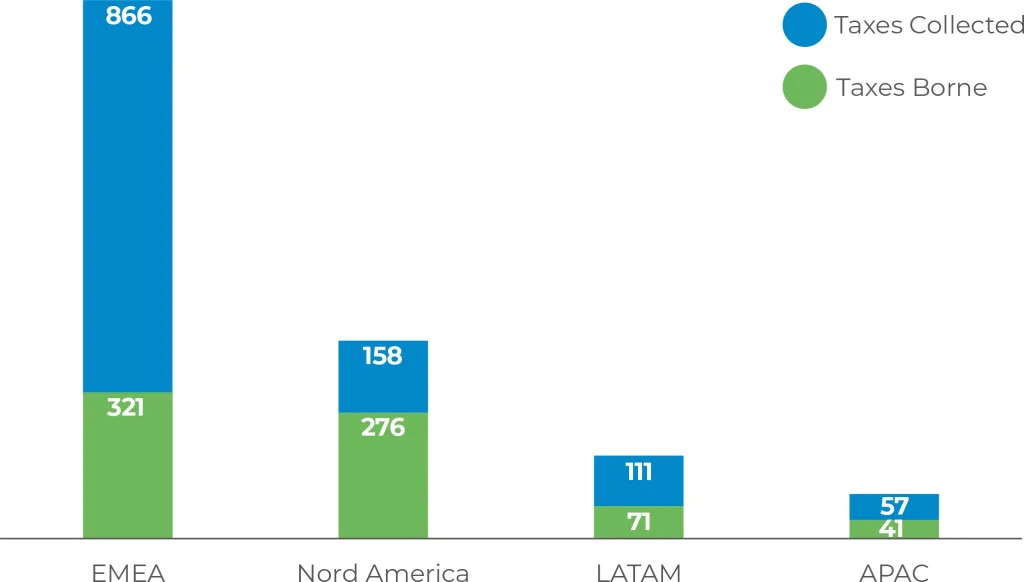
Comprehensive tax contribution
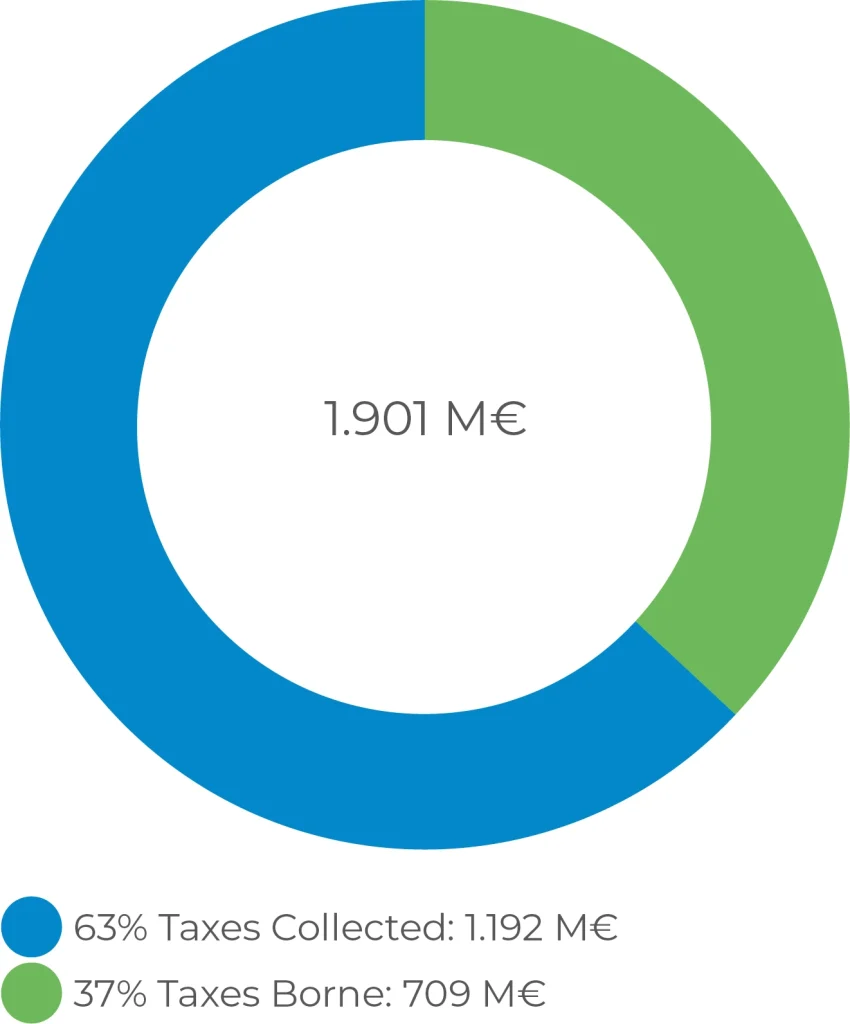
Distribution of the comprehensive tax contribution
Cybersecurity
| Description | Unit of measurement | 2023 | 2022 |
|---|---|---|---|
| Information Security training courses | Number | 27 | 18 |
| Average time for high-risk vulnerability resolution | Weeks | 15 | 15 |
| Log sources integrated with SIEM solution | Percentage | 89 | 89 |
| Security incidents | Number | 1,199 | 707 |
| Cyber-attacks on total security incidents | Percentage | 1 | 3 |
| Average time for forensic activities after an incident | Hours | 4 | 4 |
Environment
Environmental Responsibility
Prysmian's ambition is to be the global benchmark in sustainability. This ambition is brought to life through the ongoing Group’s investments to improve its environmental performance, maximize the positive impacts and mitigate any negative impacts generated across the entire value chain.
Topics
SDG's

Goals: 2023-2025 Prysmian Scorecard
| Category | KPI | Material topic and related impact | Baseline 2022 |
Baseline 2023 |
Target 2025 |
|---|---|---|---|---|---|
| Climate | Percentage reduction in GHG emissions (Scope 1 and 2 Market-Based) vs baseline 20191 | Facilitating decarbonization to reach Net-Zero and digitalization | Contribution to Scope 1 and 2 greenhouse gas (GHG) emissions as a result of direct activities | -28% | -33% | -38%/-40% |
| Percentage reduction in Scope 3 emissions vs Baseline 20192 | Facilitating decarbonization to achieve Net-Zero and digitalization | Contribution to Scope 3 greenhouse gas (GHG) emissions as a result of indirect activities | -7.50% | -10% | -11.5%/-15% |
1 Reduction in CO2 emissions (Scope 1 and 2) compared to 2019, according to SBTi methodology. Scope 2 is calculated using the Market-based method.
2 Reduction in CO2 emissions from the entire value chain (Scope 3) compared to 2019, according to the SBTi methodology. In 2023, during the long-term target approval process, Prysmian – at SBTi's request – also recalculated some Scope 3 categories using updated emission factors. Therefore, the value of Scope 3 for 2022 has been revised from what was published in 2022 Report.
2 Reduction in CO2 emissions from the entire value chain (Scope 3) compared to 2019, according to the SBTi methodology. In 2023, during the long-term target approval process, Prysmian – at SBTi's request – also recalculated some Scope 3 categories using updated emission factors. Therefore, the value of Scope 3 for 2022 has been revised from what was published in 2022 Report.
2023 Performance
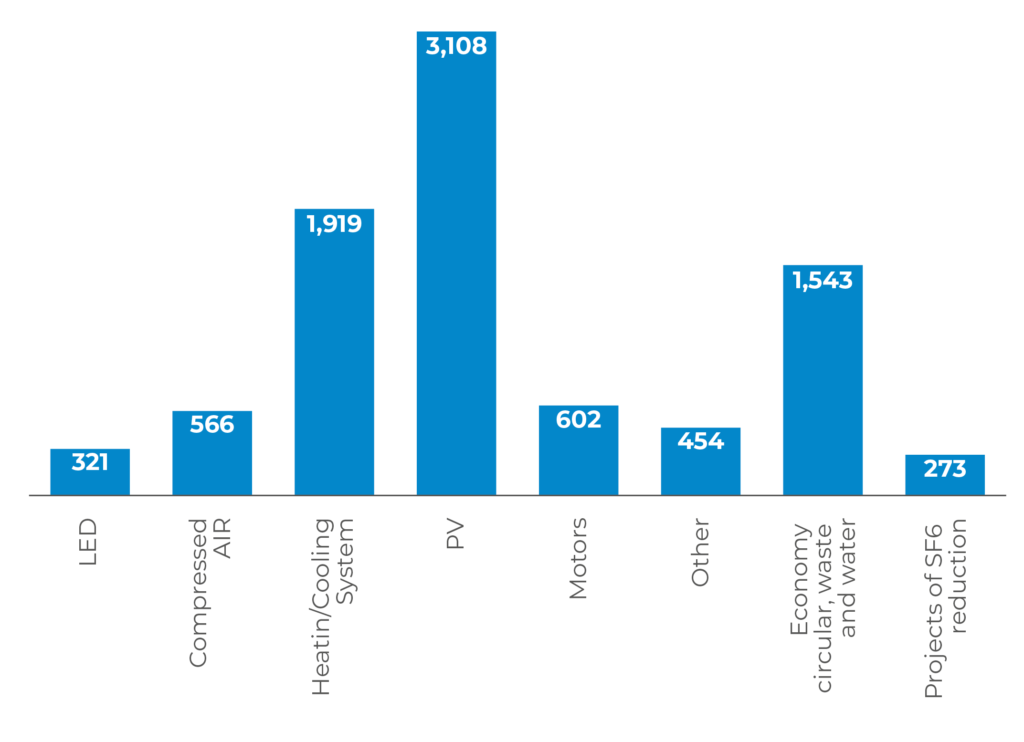
Environmental Investments (€ K)
Energy consumed (GJ) (*)
| 2023 | 2022 | |
|---|---|---|
| Electricity from renewable sources | 1,948,875 | 1,921,399 |
| Electricity from non renewable sources | 4,193,696 | 4,112,089 |
| Natural gas | 2,277,375 | 2,747,360 |
| LPG | 127,805 | 135,365 |
| Petrol | 7,561 | 7,424 |
| Diesel | 908,062 | 896,985 |
| Fuel oil | 17,380 | 5,571 |
| Steam (purchased, not produced internally) | 5,616 | 9,791 |
| Heat from district heating produced from renewable sources | 20,318 | - |
| Steam (purchased from distribution networks) | 123,539 | 135,931 |
| Chilled water | - | - |
| Biogas/biofuel/biomass purchased | 877 | - |
| Total | 9,631,104 | 9,971,915 |
(*) The term “Energy Consumed” means the number of Gigajoules (GJ) of energy consumed within the organization. This comprises energy purchased from sources outside the organization (e.g. electricity, heating, cooling and steam purchased for consumption) or generated by the latter (e.g. fuel used in self-generation activities). The 2022 and 2023 figures contain estimates for the Chiplun site only, since Sohar reported normally. The figures include consumption by the fleet, which were previously reported separately.
Emissions of tCO₂ (*)
| 2023 | 2022 | ||
|---|---|---|---|
| Scope 1 (1) | Direct emissions from combustion (**) | 205,762 | 232,178 |
| Emissions from refrigerant gas leaks | 5,177 | 3,696 | |
| Emissions from SF6 gas leaks | 15,192 | 61,852 | |
| Total Scope 1 | 226,131 | 297,725 | |
| Scope 2 (2) | Location-based | 474,715 | 501,745 |
| Market-based | 38,928 | 367,379 | |
| Total | Scope 1 and Scope 2 (Location-based) (3) | 700,846 | 799,470 |
| Scope 1 amd Scope 2 (Market-based) (4) | 616,059 | 665,104 | |
| Scope 3 (5) | 267,433,725 | 274,685 | |
| Total | Scope 1 Scope 2 and Scope 3 | 268,049,784 | 275,608,789 |
(*) 2022 and 2023 GHG emissions were estimated only for Chiplun. The amounts reported in the Group Scorecard do not contain these estimated values.
(**) Direct emissions from combustion include emissions from the fleet already separately disclosed in previous non-financial statements. In 2023, the direct emissions from combustion totaled 147,820 tons of CO2, which corresponds to 65% of the Group’s Scope 1 amounting to 226,131 tons of CO2). 2).
(1) Scope 1 emissions comprise the direct emissions of the organization, being those generated from resources under its direct control. Reported Scope 1 emissions refer to combustion processes (natural gas, LPG, petrol, diesel, fuel oil, marine diesel), refrigerant gas leaks (emissions from refrigerant gas leaks currently consist of releases of Chlorofluorocarbons – CFCs – and Hydrochlorofluorocarbons – HCFCs – from air conditioning systems), and SF6 gas leaks.
(2) Scope 2 Emissions comprise the indirect emissions of the organization, being those deriving from its direct consumption excluding generation activities. These include: purchased electricity, district heating and steam.
(3) Scope 2 Emissions - Location-based method quantifies these emissions with reference to average Scope 2 CO2 emission factors for the energy generated within well-defined (e.g. local, sub-national or national) geographical boundaries.
(4) Scope 2 Emissions - Market-based method quantifies these Scope 2 CO2 emissions with reference to the CO2 emissions of the energy suppliers from which the reporting company purchases, under contract, an electricity package. Markets differ on the contracts available for the purchase of energy or on the claim of specific attributes, but may include: energy guarantees of origin and direct contracts with suppliers (RECs, GOs, I-REC, etc.); supplier-specific emission factors; default emission factors that represent uncontrolled or unclaimed energy and emissions (defined as “residual mix”); average regional, sub-national or national emission factors.
(5) Scope 3 Emissions comprise the indirect emissions generated by the organization throughout the value chain, via its upstream and downstream processes. These include the emissions deriving from purchased goods and services, the purchase of capital goods, fuel consumption and energy-related activities, upstream transportation and distribution, waste generated by operations, business travel, employee commuting, upstream leased assets, downstream transportation and distribution, use of sold products, end-of-life treatment of sold products, and investments.
Waste by destination (kg)
| 2023 | 2023 % | 2022 | 2022 % | |
|---|---|---|---|---|
| HAZARDOUS WASTE | 12.381.045 | 14.050.194 | ||
| Landfill | 1,740,750 | 14% | 2,166,186 | 15% |
| Incinerator | 2,852,812 | 23% | 2,815,748 | 20% |
| Recycled | 6,027,126 | 49% | 6,620,003 | 47% |
| Other | 1,760,357 | 14% | 2,448,257 | 17% |
| NON-HAZARDOUS WASTE | 222,782,796 | 220,355,520 | ||
| Landfill | 41,793,434 | 19% | 42,373,457 | 19% |
| Incinerator | 1,030,721 | 6% | 13,104,990 | 6% |
| Recycled | 162,821,860 | 73% | 159,240,565 | 72% |
| Other | 5,136,781 | 2% | 5,636,508 | 3% |
| TOTAL | 235,163,841 | 234,405,714 | ||
| Landfill | 43,534,184 | 19% | 44,539,642 | 19% |
| Incinerator /td> | 15,883,533 | 7% | 15,920,738 | 7% |
| Recycled | 168,848,986 | 72% | 165,860,569 | 71% |
| Other | 6,897,138 | 3% | 8,084,765 | 3% |
Water drawn (m3) by source
| 2023 | Water stress areas | All areas | Total |
|---|---|---|---|
| Water from wells | 1,497,471 | 2,430,695 | 3,928,166 |
| Water from public water main | 457,524 | 2,134,877 | 2,592,401 |
| Water from other sources – Fresh water | - | 519,512 | 519,512 |
| Total | 1,954,995 | 5,085,084 | 7,040,079 |
| 2022 | Water stress areas | All areas | Total |
| Water from wells | 1,704,920 | 2,476,684 | 4,181,604 |
| Water from public water main | 474,587 | 2,387,648 | 2,862,234 |
| Water from other sources – Fresh water | - | 717,636 | 717,636 |
| Total | 2,179,507 | 5,581,968 | 7,761,474 |
People
People, Prysmian's human capital
Prysmian has always invested in its people and in the local communities in which it operates. Because for us, growth means being connected and spreading the culture of sustainability throughout the entire corporate population all over the world.
Topics
SDG's
Goals: 2023-2025 Prysmian Scorecard
| Category | KPI | Material topic and related impact | Baseline 2022 |
Baseline 2023 |
Target 2025 |
|---|---|---|---|---|---|
| Diversity and
inclusion |
Percentage of women employees hired 1 | Equity, diversity, inclusion and respect for human rights | | Promotion of specific programs for a more inclusive and diverse work environment | 44.90% | 46% | 47%/49% |
| Percentage of women executives 2 | Equity, diversity, inclusion and respect for human rights | | Promotion of practices to promote gender balance in Prysmian management and the BoD | 15.70% | 18.8% | 21%/24% | |
| People's well-being |
Safety Assessment Plan3 | Well-being, engagement and improvement of human capital skills | Potential accidents, mental and physical illness due to the failure to spread a culture of health and safety in the community in which the Company operates | - | 3.4 | 2.75/5 |
| Leadership Impact Index4 | Well-being, engagement and improvement of human capital skills | Engagement: adoption of people-oriented policies to meet people's needs and demands | 55% | 57% | 57%/61% |
1 Share of women desk workers hired with permanent contract compared to the total employees hired with permanent contract. The index includes all desk workers hired abroad (including global recruiting programs and projects) and all change of contracts from agency/temporary to permanent.
2 Share of women in executive positions (job grade 20 and above) as a percentage of total executive employees. The number of employees is the headcount as at 31 December 2023, including all permanent contract and temporary ones. The KPI shows the ability of the Group to develop internal figures to take on leadership roles, its capability to hire them from the market and its ability to retain those talents.
3 Index relating to the level of maturity in the safety management of the Group's various plants, calculated following an Audit conducted by a specialized third-party company. The index consists of four different categories (governance, employee engagement, risk assessment and injury frequency rate). At the end of the assessment, an overall score is given on a scale of 1 (lowest) to 5 (highest).
4 Index calculated as the percentage of employees who declared a level of engagement with the company of at least 5 out of 7 points in the Speak Up survey conducted by the company. The indices and the survey were developed in collaboration with POLIMI University in order to ensure their quality and anonymity.
Goals: Improvement of gender balance
| 2023 | Goal 2023 | 2022 | |
|---|---|---|---|
| Percentage of women of total work force | 20.5% | 20%-22% | 19.2% |
| Percentage of women hired (*) | 46% | 46%-49% | 44.9% |
| Percentage of women junior executives | 28.7% | 28%-30% | 26.9% |
| Percentage of women in middle management positions | 25.1% | 25%-28% | 24.4% |
| Percentage of women in top management positions | 12.5% | 12%-14% | 7.1% |
| Percentage of women in all managerial positions | 25.8% | 25%-28% | 24.3% |
| Percentage of women in managerial positions within revenue-generating functions | 18.9% | 19%-21% | 17.4% |
| Percentage of women in STEM functions (**) | 21.9% | 21%-23% | 19.7% |
(*) Employed women hired on a permanent basis, including changes of contract from fixed-term and agency contracts to open-term contracts.
(**) Percentage calculated only on white collar population.
(**) Percentage calculated only on white collar population.
2023 Performance
Number of employees by geographical area and by contract type
| EMEA | APAC | North America | LATAM | Total | |
|---|---|---|---|---|---|
| Number of employees | 16,197 | 2,832 | 7,219 | 3,351 | 29,599 |
| Number of permanent employees | 15,573 | 2,796 | 7,198 | 3,344 | 28,911 |
| Number of temporary employees | 624 | 36 | 21 | 7 | 688 |
| Number of full-time employees | 15,817 | 2,831 | 7,213 | 3,348 | 29,209 |
| Number of part-time employees | 380 | 1 | 6 | 3 | 390 |
Number of employees by gender and by contract type
| Male | Female | Other | Total | |
|---|---|---|---|---|
| Number of employees | 23,529 | 6,055 | 15 | 29,599 |
| Number of permanent employees | 22,972 | 5,924 | 15 | 28,911 |
| Number of temporary employees | 557 | 131 | - | 688 |
| Number of full-time employees | 23,297 | 5,898 | 14 | 29,209 |
| Number of part-time employees | 232 | 157 | 1 | 390 |
Number of employees by geographical area and position
| White Collar | Blue Collar | Total | |
|---|---|---|---|
| EMEA | 4,828 | 11,369 | 16,197 |
| APAC | 855 | 1,977 | 2,832 |
| North America | 1,625 | 5,594 | 7,219 |
| LATAM | 918 | 2,433 | 3,351 |
| Total | 8,226 | 21,373 | 29,599 |
Percentage of employees by position, gender and age bracket
| ≤30 | 30-50 | ≥50 | ||||||||||
|---|---|---|---|---|---|---|---|---|---|---|---|---|
| Male | Female | Other | Total | Male | Female | Other | Total | Male | Female | Other | Total | |
| White Collar | 52.2% | 47.7% | 0.1% | 100.0% | 64.6% | 35.3% | 0.1% | 100.0% | 73.9% | 26.0% | 0.0% | 100.0% |
| Blue Collar | 77.7% | 22.3% | 0.1% | 100.0% | 84.7% | 15.2% | 0.0% | 100.0% | 88.6% | 11.3% | 0.0% | 100.0% |
| Total | 71.6% | 28.3% | 0.1% | 100.0% | 79.0% | 20.9% | 0.1% | 100.0% | 84.5% | 15.5% | 0.0% | 100.0% |
Hours of training provided by position and gender
| Male | female | Other | Total | |
|---|---|---|---|---|
| White Collar | 240,725 | 135,309 | 95 | 376,130 |
| Blue Collar | 566,641 | 117,247 | 705 | 684,593 |
| Total | 807,366 | 252,556 | 801 | 1,060,723 |
Average hours of training provided by position and gender
| Male | Female | Other | Total | |
|---|---|---|---|---|
| White Collar | 44 | 50 | 17 | 46 |
| Blue Collar | 31 | 36 | 85 | 32 |
| Total | 34 | 42 | 58 | 36 |
Sustainable Value
Prysmian recognizes the importance of a sustainable value chain in order to maintain competitiveness and resilience. We anticipate our customers’ needs, we strengthen our bonds with suppliers and we aim to create value for them and for all of our stakeholders. This includes the communities in the areas where we operate, which we support through many donations, development initiatives and sponsorships.
Integration between the economic, social and environmental missions is at the foundation of our management model. Innovation is the leverage that makes all of this possible. We work every day for a sustainable future. We are constantly searching for balance between the value shared with consumers, the people who belong to our company and to the social communities in the areas where we operate and the planet.
Topics
SDG's


Goals: 2023-2025 Prysmian Scorecard
| Category | KPI | Material topic and related impact | Baseline 2022 |
Result 2023 |
Target 2025 |
|---|---|---|---|---|---|
| Green and Circular Economy | Portion of revenues from sustainable products 1 | Sustainable innovation and circularity| | Reduction of emissions relating to new products through the development of low-emission products (higher recycled content/recyclable products) and virtuous practices such as Design for Sustainability | 30% | 37% | 40% |
| Portion of recycled content on PE and copper sheathing2 | 10% | 12.8% | 15%/16% | ||
| Impact | Providing households with access to sustainable electricity 3 | Facilitating decarbonization to achieve Net-Zero and digitalization | Facilitating the energy transition and the process of decarbonizing the economy and digitalizing the grid | 21m | 55m | 110m |
| Providing families with rapid digital access 4 | 3m | 9m | 15m |
1 Portion of revenues from sustainable products. With the aim of making the Group's approach more organic and due to the progress made in developing sustainable products and solutions in all Regions, the company has decided to eliminate the division between Europe and the rest of the world in the calculation of this KPI, as already shown during the Capital Markets Day held in October 2023.
2 Percentage by weight of recycled content of certain purchased materials. The scope of the indicator includes 1) copper purchased at Group level, excluding occasional suppliers and semi-finished products; 2) polyethylene used for sheathing, excluding those applications for which customers do not allow the use of secondary materials.
3 Estimated households connected to green energy through Prysmian products. It includes installed capacity through photovoltaic panels, onshore and offshore wind turbines, and interconnections intended for renewable energy generation.
4 Estimated connected households with fast digital access (defined as FTTH, FTTB, DOCSIS 3.0) thanks to Prysmian products.
Performance 2023
Percentage of expenditure for goods and services addressed to local suppliers
| 2023 | 2022 | |
|---|---|---|
| EMEA | 70.8% | 69.0% |
| APAC | 86.7% | 84.0% |
| North America | 94.0% | 100.0% |
| LATAM | 95.7% | 95.0% |
Number and percentage of suppliers assessed for environmental and social impacts
| Number | Percentage | |
|---|---|---|
| Suppliers assessed for environmental impacts | 500 | - |
| Suppliers with a current or potential negative environmental impact | 97 | 19.4% |
| Suppliers assessed for social impacts | 500 | - |
| Suppliers with a current or potential negative social impact | 98 | 19.6% |
Material used by weight or volume [kTon]
| 2023 | 2022 | |
|---|---|---|
| Metals | 1,161 | 1,219 |
| Compounds (*) | 348 | 365 |
| Ingredients | 274 | 288 |
| Chemicals | 6 | 6 |
| Other (yarns, tapes and oils) | 27 | 26 |
| Total | 1,816 | 1,904 |
(*) Compounds: in the processing of rubber, mixtures of polymers and ingredients (talc, kaolin, carbon, etc.) having various functions (e.g. strengtheners, accelerants, colorants).
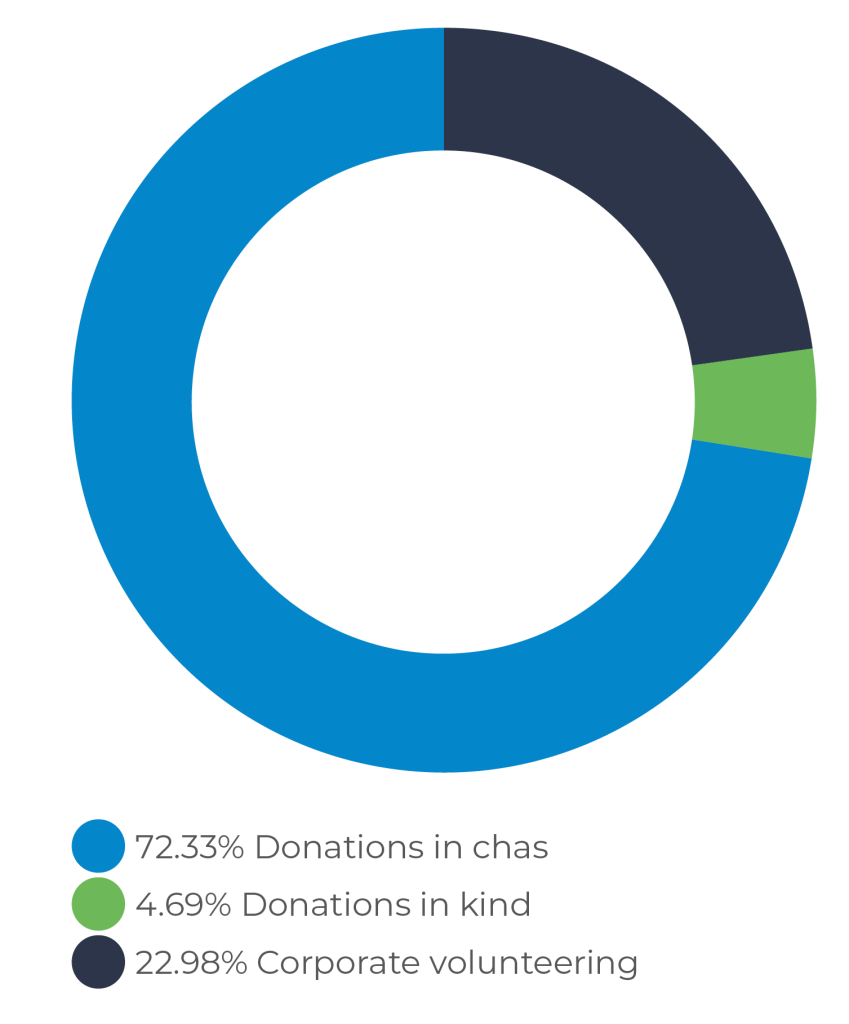
Donations - Type of donation
Donations - Type of initiative
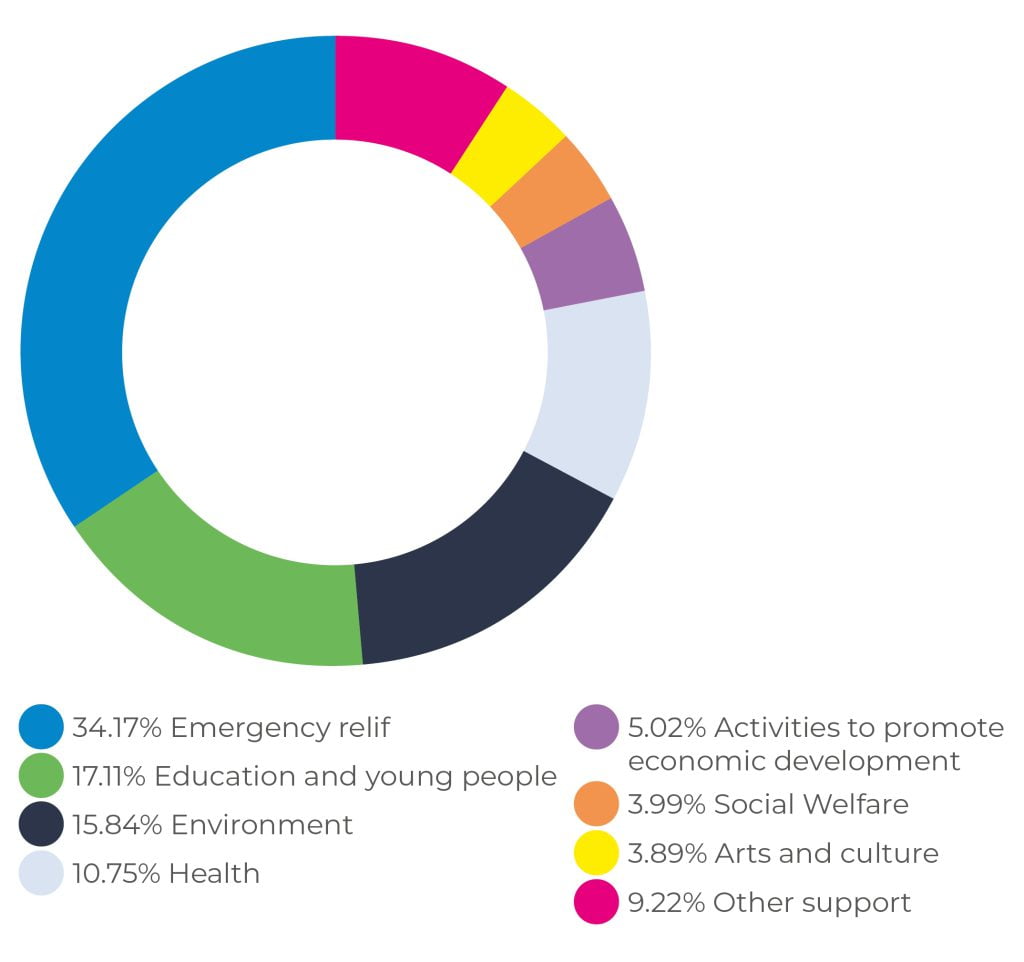
Donations - Initiative target area
Innovation - The R&D team
| Number | |
|---|---|
| Million euros investments in R&D | 128 |
| Number of patents covering the main innovations | 5,460 |
| Research centers | 26 |
| Product families launched in 2023 | 258 |
| Collaborations with research centers and universities | 50 |
| Professionals | 1,000 |
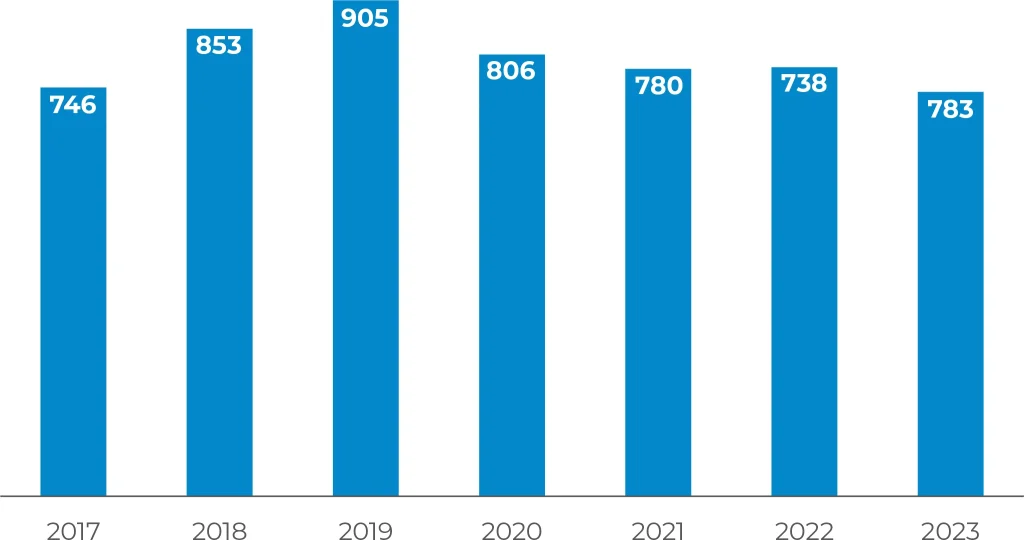
Number of patents and patent applications
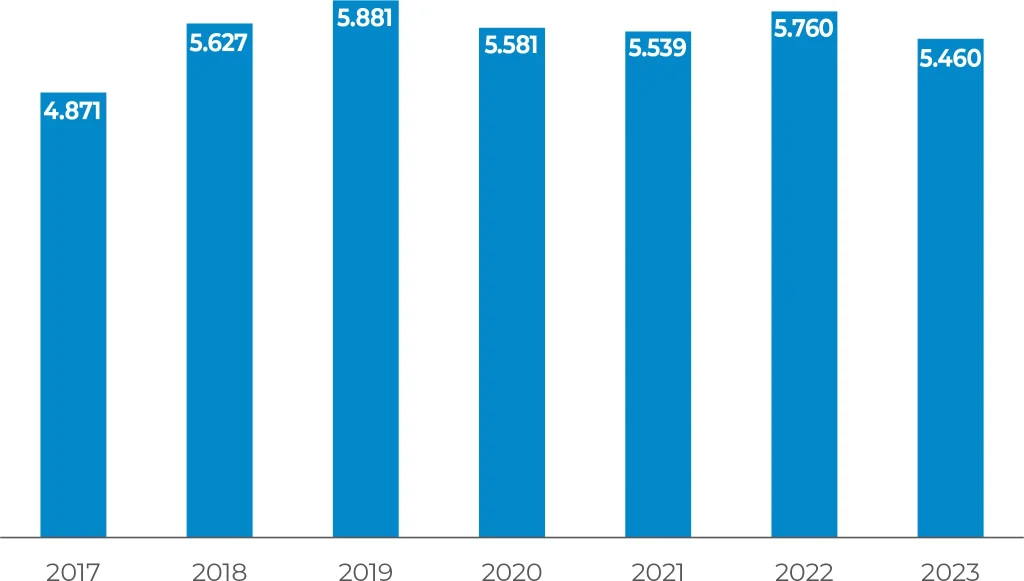
Number of patent families